In the previous article we mentioned the research by Google Research team entitled “Experts, Errors, and Context: A Large-Scale Study of Human Evaluation for Machine Translation,” in which a new quality measurement metric for machine translation called pSQM was proposed.
In a few words, pSQM is a holistic segment-level metric of a translation’s quality, in which a professional linguist assesses the quality of translation of a sentence as a whole, without a detailed analysis of individual errors, on a numerical scale of 0 to 6. The grading of the scale is precisely defined and this allows linguists to be quite consistent in their assessment of a translation quality. The assessment appears less detailed than an analytical MQM-based assessment in which a linguist analyzes the separate mistakes, categorizes them and assigns them a “severity” level. However, it shows an excellent correlation with a full-scale analytical MQM assessment at the source level (translator or MT engine) and a good one at the segment level.
Altogether assessments were carried out on a sample of 1,500 sentences, so the result is reliable and representative.
In addition to the research described in the article, we carried out a further calculation: taking the body of sentences on which the research was performed (and which was published for general access along with the article itself), we constructed for all pairs of this body, a vector proximity coefficient, using the multilingual model LABSE.
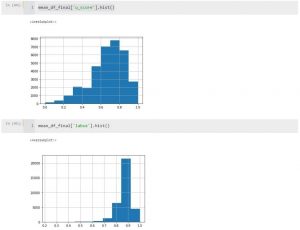
Two histograms are shown below of the distribution of assessments of translation quality of the EN-DE pair, the first one being pSQM, and the second the LABSE vector proximity:

The upper histogram–the distribution of linguists’ assessments of translations by the pSQM metric–on a seven-point scale from 0 to 6, normalized in the interval 0 to 1. This is a fairly typical distribution of a holistic assessment with a median in the region of 0.75. At the same time the linguists noted somewhat worse, poorly and even very poorly translated sentences.
We constructed the lower histogram from the experimental data by comparing the vector proximity of reference translations and the output of MT engines.
Comparing the two histograms it is evident the sentences closer to the BERT viewpoint (by adjacent words and their combinations) are not close from the viewpoint of a human, who analyzes the meaning of the sentences. In essence, the proximity of BERT, which is very “closely-grouped,” is on average 0.8, merely indicates that the MT output and the final human translation are lexically close. It doesn’t tell us anything about the quality of the translation, which is determined by the accuracy of conveying the idea and the readability of the piece.
It isn’t even that the basic metric on the embeddings overvalues the “quality” of the MT output but that the shape of this distribution is completely different from that assessed by a human.
Quality again eludes automatic metrics, even those that are based on the most advanced neural models.
Essentially, these graphs illustrate the fact that embeddings capture traces of the idea and word usage but not the idea itself, which they aren’t able to analyze and process. Thus, they can’t reflect the quality of a given translation.
What do the two graphs tell us? They indicate that if the result of machine translation appears to be fluent “when taken as a whole,” it certainly doesn’t mean the translation is accurate and error-free. This proves that the superficial fluency of a machine translation is misleading and conceals the inaccurate transfer of the idea with its numerous flaws; that “a good machine translation” is a mirage that obscures the need for a translator and editor to work on the entire text.
These are the results of an experiment in which those conducting it didn’t analyze the material in context but worked like a machine translation with single, unrelated and mixed sentences. The evaluation of in-context translation quality would have been even worse.